


SPX Monitoring Purposes: Long SPX on 2/6/23 at 4110.98.
Monitoring Purposes GOLD: Long GDX on 10/9/20 at 40.78.
Long Term SPX Monitor Purposes: Neutral.
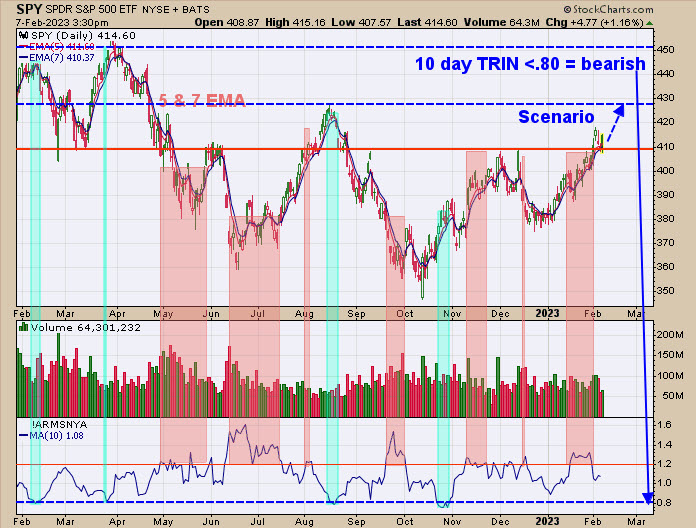
The bottom window is the 10-day average of the TRIN. A 10-day average of the TRIN above 1.20 (which shows panic is present in the market and panic form near lows) has been bullish, which is noted in light tan. 10-day TRIN near .80 and below has been bearish for the market, as noted in light blue. There is evidence that SPY may rally to the next resistance, the August high, which comes in near 430. If the 430 on SPY is reached and the 10-day TRIN falls to .80 or below, we have a possible topping area that would be suggested. We would need other evidence to prove that point, but the 10-day TRIN would be an important factor. However, if volume is good and the Advance/Decline remains strong, then SPY could go to the next higher target, the April high near 450. We will remain long the SPX.
Yesterday we said, “Bullish intermediate-term rallies form when the NYSE McClellan Summation index falls below -700 (capitulation) and than rallies to +1000 (Sign of Strength). The summation index reached below -1000 in early October and reached +1000 February 3, 2023, which confirms an intermediate term rally.” Some traders are wondering what the prospects look like for the NASDAQ. The middle window above is the Nasdaq Summation index. An intermediate-term sign is triggered when the Nasdaq Summation index falls below -1000 (triggered in early October) and then rallies to +600 (closed yesterday at +593; close enough). Therefore, Nasdaq also gave a bullish intermediate term sign. The bottom window is the Nasdaq McClellan Oscillator. Bullish short term signs are triggered when the Oscillator falls below -300 (capitulation) and then rallies above +300 (Sign of Strength) within 30 days. We have circled in red when these limits where met. Notice that there were three times last year these limits were met, where previous years have shown it happen only once a year during the bottom process of 2018 and 2020. Not sure what that means, but it may add to the bullish outcome.
Above is a trend-following method that works well. The bottom window is the weekly cumulative GDX Advance/Decline percent, and the top window is the weekly GDX Up Down Volume percent, and both indicators have their Bollinger Bands. When both indicators are above their Bollinger Bands and Bollinger Bands are rising (both conditions are present in current market), then the trend is considered up. We have drawn on the GDX chart (middle window) a red dotted trend line which represents support, which is near the 30.00 level, and GDX is testing that area of support now. The up trend appears to be in the early stages.
Tim Ord,
Editor
www.ord-oracle.com. Book release “The Secret Science of Price and Volume” by Timothy Ord, buy at www.Amazon.com.
Signals are provided as general information only and are not investment recommendations. You are responsible for your own investment decisions. Past performance does not guarantee future performance. Opinions are based on historical research and data believed reliable; there is no guarantee results will be profitable. Not responsible for errors or omissions. I may invest in the vehicles mentioned above.